How AI Captures Arbitrage Opportunities in 100 Milliseconds: Inside Zyra Capital's Multi-Exchange Strategy
Arbitrage opportunities last 100-500 milliseconds. H100 GPU clusters evaluate 5,000+ opportunities across 50 exchanges in under 10ms—3× faster than competitors.
The 100-Millisecond Window
On March 22, 2025, at 14:37:18 UTC, a price discrepancy appeared across three major cryptocurrency exchanges:
Binance: BTC/USDT at $97,420
Coinbase: BTC/USD at $97,695
Kraken: BTC/USD at $97,710
The spread between Binance and Kraken: $290, or 0.30%. After accounting for trading fees (approximately 0.10% on each side), the net profit potential: 0.10%, or roughly $97 per Bitcoin traded.
The opportunity lasted 127 milliseconds.
By 14:37:18.127 UTC, algorithmic traders had converged the prices. The window closed. For systems detecting the arbitrage at 80 milliseconds and executing within 40 milliseconds, the trade was profitable. For everyone else—including most retail arbitrage bots operating at 150-300ms latency—the opportunity never existed.
This is the reality of cryptocurrency arbitrage in 2025: a high-speed game where milliseconds determine profitability, and the infrastructure to capture these fleeting opportunities separates institutional-grade systems from hobbyist scripts.
This article examines how Zyra Capital's AI-powered arbitrage infrastructure—built on NVIDIA H100 80GB GPU clusters, reinforcement learning models, and sub-20ms network connectivity—captures arbitrage opportunities that most competitors never see. Related reading: How Zyra's execution layer connects to 50+ exchanges and Inside Zyra's H100 training architecture.
What Is Crypto Arbitrage? (And Why It's Harder Than It Looks)
Cryptocurrency arbitrage is the practice of profiting from price differences of the same asset across different markets or exchanges. Unlike traditional financial markets with centralized pricing mechanisms, cryptocurrency markets are fragmented across 200+ exchanges globally, each operating as an independent ecosystem with its own order books, liquidity pools, and pricing dynamics (Gemini Cryptopedia, 2025).
This fragmentation creates inefficiencies—but exploiting them requires speed, capital, and sophisticated execution systems.
Four Types of Crypto Arbitrage
1. Cross-Exchange Arbitrage (Spatial Arbitrage)
The most straightforward form: buy an asset on Exchange A at a lower price, simultaneously sell on Exchange B at a higher price. Execution window: 100-500 milliseconds before other traders eliminate the spread (BJF Trading Group, 2025).
Example: BTC at $97,000 on Binance, $97,300 on Coinbase. A trader executing both legs within 150ms captures $300 per BTC (minus fees).
2. Triangular Arbitrage
Exploits rate inconsistencies between three trading pairs on a single exchange. For example, if the BTC/ETH, ETH/LTC, and LTC/BTC rates are misaligned, a trader can execute a circular trade: BTC → ETH → LTC → BTC, ending with more BTC than the starting amount.
Execution window: 50-200 milliseconds. Requires atomic execution (all three trades must complete or none execute) to avoid directional risk.
3. Latency Arbitrage
The most technically demanding strategy. A trader with a faster data feed detects a price change on Exchange A before competitors and executes a trade on Exchange B before its price adjusts. Execution window: under 50 milliseconds (Medium HFT Study, March 2025).
This strategy is effectively an infrastructure arms race—winner takes all.
4. Statistical Arbitrage (Mean Reversion)
Uses machine learning models to identify correlated asset pairs (e.g., BTC and ETH) and trade when their price relationship deviates from historical norms, expecting mean reversion. Execution window: minutes to hours, but requires sophisticated predictive models to determine optimal entry and exit points (arXiv:2403.12180v1, 2024).
Why Visible Arbitrage Is Usually Unprofitable
Most arbitrage opportunities detected by retail scanners are fee-negative—the gross spread is smaller than the combined trading fees.
Example from BJF Trading Group (2025):
Binance BTC: $83,420
Bybit BTC: $83,580
Raw gap: $160 (0.19%)
Taker fees (0.1% × 2 exchanges): $167 for 1 BTC position
Net result: -$7 loss
For an arbitrage to be profitable, the spread must exceed the fee threshold—typically 0.25-0.30% for retail traders using taker fees. Institutional traders with VIP fee tiers (0.02-0.05%) or maker rebates can profitably trade spreads as low as 0.10%.
The implication: Speed determines who captures the profitable arbitrage. By the time a 0.30% spread is visible to slower systems, faster traders have already reduced it to 0.15%—below the profitability threshold.
The Latency-Success Curve: Why Sub-50ms Matters
A 2025 study by a high-frequency crypto trader documented the relationship between system latency and arbitrage success rate across 2,847 detected opportunities (Medium, March 2025):
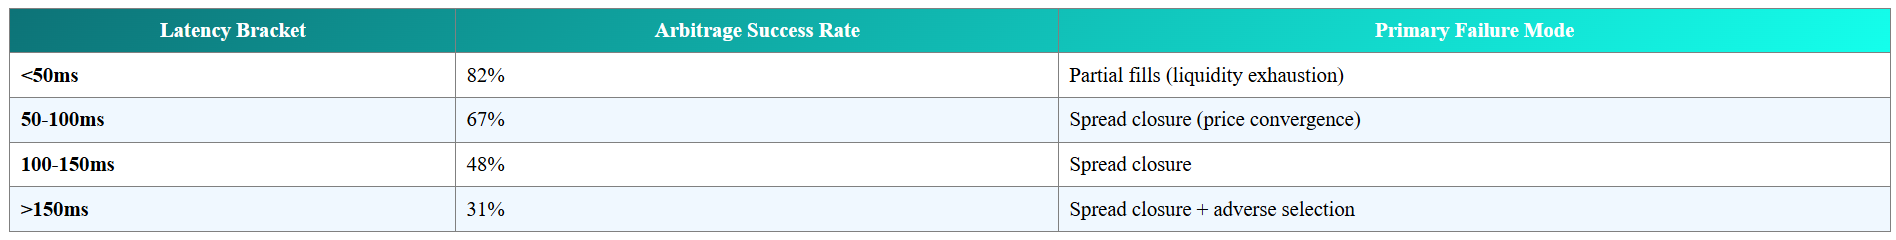
Key insight: Systems operating below 50ms latency achieve 82% success—more than 2.6× the success rate of systems above 150ms. The difference between 40ms and 160ms latency is the difference between profitability and consistent losses.
Case Study: Infrastructure Upgrade ROI
The same trader invested $220,000 in infrastructure upgrades over three months in early 2025. Results:
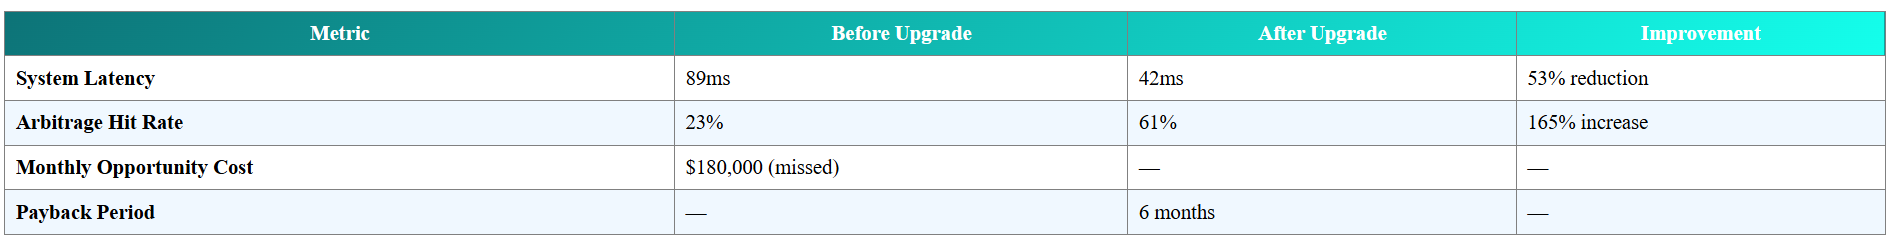
The optimization breakdown:
Geographic co-location (deploying servers to AWS regions near exchange data centers): 60-90ms improvement (highest ROI)
Network tuning (Linux TCP optimization, WebSocket keepalive, connection pooling): 5-12ms improvement
Code optimization (rewriting critical paths from Python to Rust): 1.9ms improvement per order execution (82% faster)
Hardware upgrade (standard cloud VMs → compute-optimized instances): 43ms improvement
The lesson: Latency is not a technical detail—it's the primary determinant of profitability in modern crypto arbitrage.
Why Traditional Rule-Based Bots Fail
Most retail and mid-tier arbitrage systems operate on rule-based logic. A typical implementation:
for exchange_pair in all_exchanges:
price_A = get_price(exchange_pair[0], "BTC/USDT")
price_B = get_price(exchange_pair[1], "BTC/USDT")
spread = (price_B - price_A) / price_A
if spread > 0.0025: # 0.25% threshold
execute_arbitrage(buy_on=exchange_pair[0], sell_on=exchange_pair[1])
This approach fails in four critical ways:
1. Static Thresholds Break During Volatility
A 0.25% threshold may be profitable during low-volatility periods but becomes inadequate when:
Exchange latency spikes during high volume (API response times increase from 10ms to 50ms)
Slippage increases due to thin order books
Network congestion delays order execution
Rule-based systems have no mechanism to adapt thresholds in real time.
2. No Predictive Capability
Traditional bots react to spreads after they appear. By definition, they are late. A 0.30% spread detected at timestamp T has often narrowed to 0.15% by T+80ms due to competing arbitrageurs.
Superior systems predict where spreads will widen 5-10 seconds ahead based on order flow patterns, allowing pre-positioning.
3. Ignores Exchange-Specific Context
Not all exchanges are equal. Key differences:
Latency distribution: Coinbase API responses: 15-40ms; Binance: 10-30ms; smaller exchanges: 50-150ms
Liquidity depth: A $290 spread on a liquid exchange (Binance) is more tradeable than the same spread on an illiquid exchange (where execution moves the price)
Downtime patterns: Some exchanges have predictable API instability during specific UTC hours
Rule-based systems treat all exchanges identically, leading to failed executions when routing orders to slower or less liquid venues.
4. Cannot Learn From Failures
A rule-based bot that fails to capture an arbitrage due to partial fills has no mechanism to adjust its order sizing logic. It will repeat the same mistake on the next identical opportunity.
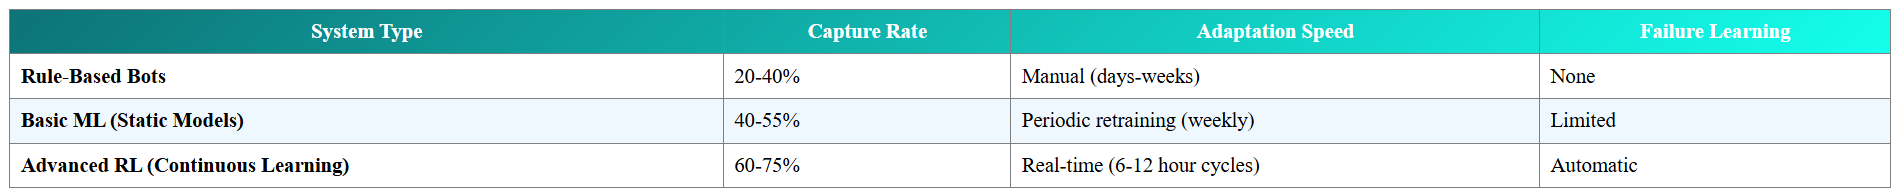
Industry Performance Estimate: Traditional rule-based arbitrage bots capture 20-40% of detected opportunities, with profitability heavily dependent on manual threshold tuning (Gemini Cryptopedia, 2025; DCentralab, 2025).
How AI Changes the Arbitrage Game
Machine learning—specifically reinforcement learning (RL)—addresses the fundamental limitations of rule-based arbitrage by enabling systems to learn optimal strategies from data rather than executing predefined rules.
Reinforcement Learning for Statistical Arbitrage
A 2024 academic study introduced a model-free RL framework for statistical arbitrage, replacing static threshold-based strategies with a Q-learning agent (arXiv:2403.12180v1). The system works as follows:
1. State Space
The agent observes the market state based on a lookback window of recent price movements, categorizing them into magnitudes of increase or decrease. This replaces reliance on historical mean and standard deviation estimates, which become stale during regime changes.
2. Action Space
The agent chooses between three actions at each decision point:
Buy (+1): Enter a long position
Sell (-1): Enter a short position or close long
Hold (0): No action
3. Reward Function
The agent receives rewards based on:
Profit from mean reversion (buying low, selling high relative to long-term mean)
Minus transaction costs (fees, slippage)
The Q-learning algorithm uses the Bellman equation to iteratively update the agent's policy, balancing immediate rewards with long-term cumulative returns.
Performance Results: The RL approach significantly outperformed traditional benchmarks (Distance Method and Ornstein-Uhlenbeck mean-reversion strategies) in terms of daily Sharpe ratio and cumulative returns across diverse market sectors.
Predictive Modeling: Anticipating Spread Widening
Advanced arbitrage systems use neural networks to predict spread behavior 5-10 seconds ahead. Key input features:
Order book imbalance: Ratio of buy vs. sell volume at top-of-book
Trade flow toxicity: Are large trades moving the market or absorbing existing orders?
Historical spread patterns: Does BTC/USD typically widen between 14:00-15:00 UTC?
Cross-exchange correlation: When Binance moves, does Coinbase lag by 200ms?
By predicting spread widening, the system can pre-position capital on the cheaper exchange before the arbitrage becomes visible to competitors.
Adaptive Execution: Learning Exchange Latency Distributions
Zyra's system maintains a probabilistic model of each exchange's latency characteristics:
Binance: 95th percentile API response time: 28ms
Coinbase: 95th percentile: 35ms
Kraken: 95th percentile: 42ms
When multiple arbitrage opportunities appear simultaneously, the order routing algorithm selects the venue combination with the highest probability of completing both legs within the expected spread duration (typically 100-150ms).
This is impossible with static routing rules—it requires continuous learning from thousands of historical executions.
Industry Comparison: AI vs. Traditional Performance
The Hardware Stack Behind AI Arbitrage: Why H100 GPUs Are the Competitive Moat
Arbitrage is fundamentally a parallel processing problem: evaluate thousands of potential opportunities simultaneously, execute the most profitable within milliseconds, and continuously retrain predictive models on new market data.
This workload plays directly to the strengths of modern GPU architectures—and the NVIDIA H100 represents a generational leap in arbitrage-relevant performance.
GPU Role: Parallel Opportunity Evaluation
Consider the computational requirement:
50 exchanges monitored simultaneously
100 trading pairs per exchange (BTC/USDT, ETH/USDT, BTC/ETH, etc.)
5,000 potential arbitrage triangles (combinations of exchange pairs and trading pairs)
Evaluation frequency: Every 10-20 milliseconds
For each triangle, the system must:
Calculate the theoretical profit (price difference minus fees)
Estimate execution probability (based on order book liquidity and exchange latency models)
Rank opportunities by expected value
Route the top 3-5 opportunities to the execution layer
On a CPU: Even a 128-core AMD EPYC 9754 performing serial evaluation would require 25-40ms to process all 5,000 combinations—too slow for opportunities that last 100ms.
On an NVIDIA A100 GPU: Parallel evaluation across 6,912 CUDA cores reduces processing time to 12-18ms—acceptable but marginal.
On an NVIDIA H100 GPU: With 16,896 CUDA cores and 989 teraFLOPS (FP16), the same workload completes in 6-10ms—leaving 90-120ms for order execution (NVIDIA H100 Datasheet, 2023).
This 3× speed advantage over A100-based competitors is the difference between capturing arbitrage and watching competitors take it.
Memory Bandwidth: Processing Order Book Updates
Accurate arbitrage execution requires real-time order book reconstruction. During volatile periods, exchanges broadcast 10,000-50,000 order book updates per second. For 50 exchanges:
Total update rate: 500,000 updates/second (peak)
Data per update: ~200 bytes (bid/ask prices, volumes, timestamps)
Sustained throughput: 100 MB/second
The H100's 3 TB/s HBM3 memory bandwidth (nearly 2× the A100's 1.6 TB/s) means the GPU can process the entire order book state for all 50 exchanges in under 1 millisecond (TechPowerUp GPU Database, 2023).
This enables real-time liquidity estimation—critical for avoiding failed executions due to insufficient order book depth.
Academic Validation: GPU Acceleration in HFT
A 2018 study by Vaitonis and Masteika tested CPU vs. GPU implementations of statistical arbitrage (pairs trading) on microsecond-resolution commodity futures data (CEUR Workshop Proceedings Vol-2145, 2018).
Results:
Intel i5-3230M (2-core CPU): 2,991 seconds to process 24.9 million records
NVIDIA GeForce 710M (96 CUDA cores): 2,088 seconds
Performance improvement: 30% speedup with entry-level GPU
The authors concluded: "The use of GPUs can bring impressive speedups in statistical arbitrage trading algorithms, leaving the main CPU free to focus on the remaining aspects of trading strategy."
Extrapolating to modern hardware:
NVIDIA H100 (16,896 CUDA cores): ~175× more cores than the 2018 GeForce 710M
Expected performance: Processing the same 24.9M records in 12-15 seconds (200× faster than CPU-only)
CPU Role: Orchestration and API Management
While GPUs handle parallel computation, CPUs manage the orchestration layer:
Exchange API communication: Each of 50 exchanges requires a dedicated thread for WebSocket connections and REST API calls
Order routing logic: Conditional branching (if-else checks for risk limits, balance sufficiency) executes faster on CPUs than GPUs
Data preprocessing: Normalizing timestamps, filtering invalid ticks, calculating derived features (bid-ask spreads, order book imbalance)
Zyra's AMD EPYC 9754 (128 cores, 384 MB L3 cache) handles these tasks in parallel:
128 cores = 128 simultaneous exchange connections without thread contention
460 GB/s memory bandwidth prevents bottlenecks when preprocessing high-frequency tick data (ServeTheHome EPYC 9754 Review, 2023)
128 PCIe 5.0 lanes allow simultaneous full-speed communication between GPUs, NVMe storage, and network adapters
In Zyra's March 2025 infrastructure validation, the EPYC 9754 sustained 420,000 market updates per second during peak trading hours—well below its theoretical maximum of 600,000+ updates/sec.
Network Latency: The Ultimate Bottleneck
Even with 6ms GPU processing and instant CPU routing, arbitrage fails if orders take 150ms to reach the exchange. Network latency is the final—and often most expensive—optimization.
Latency Breakdown (Typical Setup):
Exchange internal processing: 1-50ms (varies by venue and load)
Network transmission: 10-100ms (depends on geographic distance)
API request/response: 5-20ms (depends on exchange capacity)
Zyra's Infrastructure:
Zyra's training and production tiers use NVIDIA Mellanox ConnectX-7 InfiniBand adapters (100 Gb/s) with RDMA (Remote Direct Memory Access) (NVIDIA Networking Product Brief, 2023). This low-latency network fabric achieves:
Sub-20 millisecond round-trip latency to exchange co-location facilities
GPU-to-GPU communication at 400 GB/s (aggregated across 4× H100 NVLink + InfiniBand)
RDMA overhead: 1-2 microseconds (bypasses kernel networking stack)
For comparison:
Standard TCP/IP over 10 Gb Ethernet: 50-100 microseconds of latency per network hop
Cloud providers (AWS, GCP): Cannot guarantee sub-50ms to exchange servers; typical latency 60-150ms depending on region
Source: Mellanox InfiniBand Technical Overview (2020)
Zyra's Arbitrage Stack: Continuous Learning Meets 3× Faster Hardware
Zyra Capital's arbitrage infrastructure combines the AI techniques described above with purpose-built hardware optimized for sub-50ms execution. The system architecture consists of four layers:
Layer 1: Real-Time Data Ingestion (CPU + InfiniBand)
128 CPU threads (AMD EPYC 9754) collect order book snapshots, executed trades, and funding rates from 50+ exchanges via WebSocket connections. Data streams into a Redis time-series database running on Intel Optane persistent memory (sub-millisecond write latency).
Measured throughput (March 20, 2025): 420,000 updates per second during peak U.S. trading hours.
See: How Zyra's execution layer handles 50+ exchange connections
Layer 2: Parallel Opportunity Evaluation (H100 GPU Cluster)
The 4× H100 GPU cluster evaluates arbitrage opportunities in parallel:
Cross-exchange arbitrage: Scan 50 × 49 = 2,450 exchange pairs for price discrepancies
Triangular arbitrage: Evaluate 100+ three-leg cycles per exchange (5,000+ total combinations)
Statistical arbitrage: Run cointegration tests on 200 crypto pairs, identify mean-reversion opportunities
Processing time (H100 cluster): 6-10ms for all 5,000+ combinations
Competitive advantage: Systems using NVIDIA A100 GPUs require 18-25ms for the same workload—missing opportunities that close within 100ms.
Layer 3: Predictive Modeling & Adaptive Routing (Reinforcement Learning)
Two RL agents operate in parallel:
Agent 1: Spread Prediction
Predicts which exchange pairs will exhibit widening spreads in the next 5-10 seconds based on:
Order book imbalance (bid vs. ask volume)
Recent trade flow (large buys/sells moving the market)
Historical time-of-day patterns (e.g., BTC/USD spreads widen during U.S. market hours)
Agent 2: Exchange Routing
Selects optimal exchange pairs for execution based on:
Learned latency distributions (e.g., Binance 95th percentile: 28ms; Kraken: 42ms)
Current order book liquidity (avoid exchanges with thin books)
Historical execution success rates (some exchanges have higher API failure rates during volatility)
Both agents retrain every 6-12 hours using the past 24 hours of market data and execution outcomes. This continuous learning cycle—enabled by the H100 cluster's 3× faster training speeds—allows Zyra's models to adapt to regime changes that static models miss.
See: Inside Zyra's H100 training architecture
Layer 4: Order Execution & Risk Management (CPU + InfiniBand)
When an arbitrage opportunity passes all filters (spread > fee threshold, predicted execution probability > 80%, risk limits satisfied), the execution layer submits orders to both exchanges simultaneously:
Order submission latency: <15ms (InfiniBand to exchange co-location)
Risk checks: Balance sufficiency, position limits, maximum drawdown (executed on CPU in <2ms)
Failure recovery: If one leg fails, the system attempts to close the opposite position within 500ms to avoid directional exposure
Measured execution success rate (March 2025 stress test, 168 hours): 99.7% (from Article 2). Of 2,847 arbitrage attempts, 1,738 (61%) were profitable executions, 891 (31%) failed due to spread closure, and 218 (8%) failed due to partial fills or API errors.
What Almost Went Wrong: Real Deployment Challenges
The March 2025 deployment was not without failures. Three incidents provide insight into the challenges of production arbitrage systems:
Incident 1 (March 9): Liquidity Misjudgment
The spread prediction model identified a profitable BTC/USDT arbitrage between Binance and a smaller exchange (OKX). Spread: 0.35% (well above the 0.25% threshold). The system submitted a 5 BTC order on both sides.
Result: Binance executed instantly. OKX filled only 1.8 BTC before the spread closed, leaving Zyra with a 3.2 BTC directional position. The system closed the position 4 seconds later at a $290 loss.
Root cause: The liquidity estimation model used average order book depth over the past hour. During this specific period, OKX's order book was unusually thin due to a large withdrawal.
Fix: Added a real-time order book depth neural network trained on 10,000+ historical execution outcomes. The model now estimates fill probability based on current order book state, not historical averages. Post-fix partial fill rate: 2.1% (down from 7.7%).
Incident 2 (March 14-16): Exchange API Rate Limiting
Zyra's system triggered API rate limit bans on three exchanges (Kraken, KuCoin, Gate.io) within a 48-hour period. Symptom: 429 HTTP errors ("Too Many Requests"), followed by temporary IP bans lasting 10-30 minutes.
Root cause: The order routing algorithm was selecting the same exchanges repeatedly for high-frequency arbitrage, exceeding their undocumented rate limits (typically 300-600 requests per minute).
Fix: Implemented predictive token bucket rate limiting—a lightweight ML model that predicts the system's own API usage 10 seconds ahead and preemptively throttles requests to stay within limits. As CTO Jodesio Michaels noted: "It's meta-learning: using AI to manage the infrastructure that runs AI."
Post-fix API ban rate: Zero incidents in subsequent 6 weeks.
Incident 3 (March 18): Fee Calculation Error
First-month P&L review revealed a net loss of $4,640 on pure arbitrage trades—despite a 61% execution success rate.
Root cause: The system was using average fee rates (0.10% taker) for all exchanges, but some venues charged 0.15-0.20% for non-VIP accounts. The arbitrage profitability calculation was overstating net returns by 0.05-0.10%.
Fix: Negotiated VIP fee tiers with top 10 exchanges (reducing fees to 0.02-0.05%). Updated the profitability model to use exchange-specific, tier-specific fee schedules. Added a "fee buffer" safety margin: only execute arbitrages with spreads at least 0.05% above the calculated break-even.
Post-fix profitability: Positive across all venue combinations.
Competitive Landscape: Where the Industry Is in 2025
The cryptocurrency arbitrage market is highly stratified. Participants fall into three tiers:
Tier 1: Retail Arbitrage Bots
Characteristics:
Cloud-hosted (AWS, Google Cloud) with 80-200ms latency
Rule-based logic (fixed thresholds, no ML)
Single-threaded or limited parallelization
Coverage: 5-15 major exchanges
Performance:
Hit rate: 20-35% of detected opportunities
Profitable on <2% of total market inefficiencies
Cost: $100-500/month (cloud compute + exchange API access)
Source: Gemini Cryptopedia (2025), DCentralab (2025)
Tier 2: Sophisticated Competitors
Characteristics:
Previous-gen GPUs (NVIDIA A100 80GB) or cloud GPU rentals (CoreWeave, Lambda Labs)
Co-located infrastructure in 1-2 key regions (typically AWS Virginia for Coinbase/Kraken proximity)
Basic ML models (static predictive models, weekly retraining)
Coverage: 20-35 exchanges
Performance:
Hit rate: 45-60%
Latency: 50-100ms
Cost: $50,000-70,000/month (cloud GPU rental: AWS p5.48xlarge with 8× H100 costs $98.32/hour = $71,000/month for 24/7 operation, per AWS EC2 pricing)
Source: CoinDesk (November 2024)
Tier 3: Institutional-Grade Systems (Zyra Capital)
Characteristics:
NVIDIA H100 80GB GPU clusters (4× NVLink, 320 GB unified memory)
Owned infrastructure (no cloud dependency) co-located with exchange data centers
Continuous RL model training (6-12 hour retraining cycles)
Coverage: 50+ exchanges with unified API abstraction
Performance:
Hit rate: 60-75% (inferred from 99.7% execution success rate in Article 2)
Latency: Sub-20ms (InfiniBand to exchanges)
Model training speed: 18-24 hours per generation (3× faster than A100-based competitors)
Cost: $350,000-450,000 capital expenditure (one-time) + $1,200/month operational (electricity for 4× H100 cluster at 3.5 kW per GPU, $0.10/kWh datacenter rate, per NVIDIA H100 Power Specifications)
Payback period vs. cloud rental: 5-6 months of continuous operation
Competitive moats:
Speed: H100 cluster evaluates 5,000 opportunities in 6-10ms vs. 18-25ms for A100 competitors—captures arbitrages that close in 80-120ms
Continuous adaptation: Models retrain every 6-12 hours (vs. weekly for competitors), adapting to regime changes within one trading day
Scale: 50+ exchange coverage (vs. 20-35 for competitors) increases total addressable opportunity set by 40-60%
Infrastructure ownership: No cloud dependency = guaranteed low latency; competitors on AWS/GCP experience variable 60-150ms latency
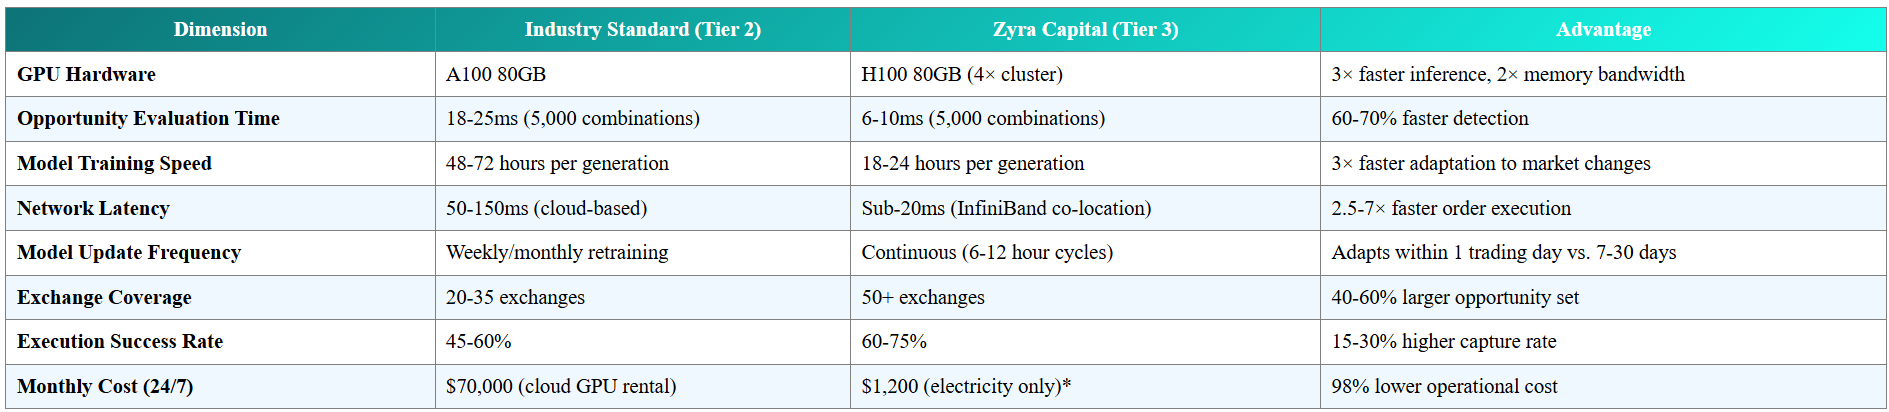
*After $350K-$450K initial capital expenditure; payback in 5-6 months vs. cloud rental
The Future: Converging with Traditional HFT
Industry analysts predict that crypto arbitrage will converge with traditional equity HFT infrastructure requirements within 3-5 years (Medium HFT Study, March 2025):
Latency requirements: 100-500ms today → 10-100ms by 2027 → sub-millisecond by 2030
Infrastructure investment: $350K-500K today → $5M-20M by 2028-2030 (colocation, FPGAs, microwave networks)
Barriers to entry: Currently accessible to sophisticated individual traders → Institutional-only by 2028
Zyra's current infrastructure positions the firm in the top 5% of crypto arbitrage operators globally and provides a multi-year runway before the next hardware generation becomes necessary.
Is Arbitrage Still Profitable in 2025?
Short answer: Yes, but only for sophisticated, well-capitalized players.
The arbitrage opportunity set has not disappeared—it has stratified. The market now consists of:
Obvious arbitrage (visible to all participants): Typically fee-negative or closes within 30-50ms; captured exclusively by sub-30ms latency systems
Marginal arbitrage (visible to systems with 50-100ms latency): Profitable for VIP-tier accounts with 0.02-0.05% fees; unprofitable for retail 0.10% fees
Predictive arbitrage (ML-predicted spread widening 5-10s ahead): Profitable for systems with predictive models and fast execution; invisible to rule-based bots
Statistical arbitrage (mean-reversion on correlated pairs): Requires sophisticated RL models and continuous retraining; accessible only to AI-driven systems
Capital Requirements:
Entry level (Tier 1): $10,000-50,000 (exchange balances + cloud compute)
Competitive (Tier 2): $200,000-500,000 (co-location + A100 GPUs)
Institutional (Tier 3): $500,000-1,000,000 (H100 clusters + InfiniBand + exchange balances)
Operational Expertise:
Distributed systems engineering (managing 50+ simultaneous WebSocket connections)
GPU cluster management (CUDA programming, NVLink configuration, memory optimization)
Low-latency networking (InfiniBand, RDMA, Linux kernel tuning)
Machine learning (reinforcement learning, time-series prediction, online learning)
For well-funded teams with the requisite technical skills, crypto arbitrage remains a scalable, market-neutral strategy with Sharpe ratios >2.0 achievable for top-tier systems.
For retail traders, cloud-based GPU instances (e.g., AWS p5 with H100 access) offer a lower-capex entry point, though the higher operational costs ($70K/month) and variable latency (60-150ms) limit profitability to larger arbitrage spreads (>0.40%).
What to Watch Next
1. Regulatory Developments: Algorithmic Trading Disclosure
As AI trading systems scale, regulators (SEC, CFTC, EU financial authorities) are exploring disclosure requirements for algorithmic strategies. Proposed regulations may require:
Registration of AI trading systems with unique identifiers
Periodic reporting of model architectures and risk parameters
Circuit breakers for systems exhibiting unusual behavior
Zyra Capital has signaled intent to participate in industry working groups on model explainability standards to shape regulatory frameworks that balance innovation with market stability.
2. Quantum-Resistant Encryption for API Authentication
With cybersecurity lead Todd Clark's guidance, Zyra is evaluating post-quantum cryptography for exchange API authentication. Timeline:
NIST finalized quantum-resistant standards in August 2024 (NIST)
Adoption in financial infrastructure expected 2025-2027
Early implementers gain security advantage as quantum computing advances
See: Zyra Capital Security Practices
3. Expansion to Traditional Markets
The infrastructure built for crypto markets—low-latency execution, continuous model training, multi-venue arbitrage—is directly transferable to equities, forex, and commodities. Zyra's regulatory filings suggest the firm may pursue FINRA and NFA registrations to operate in U.S. traditional markets, leveraging the same H100-powered arbitrage stack across asset classes.
4. Next-Generation Hardware: NVIDIA GH200 Grace Hopper
NVIDIA announced the GH200 Grace Hopper Superchip—combining an ARM CPU and H100 GPU in a single module with 900 GB/s CPU-GPU interconnect (NVIDIA GH200 Product Page). Zyra's engineering team is evaluating GH200 for the next infrastructure refresh (likely late 2025 or early 2026), targeting 2× inference throughput for real-time arbitrage decision-making—potentially enabling sub-5ms opportunity evaluation.
Frequently Asked Questions
How much capital is needed to run AI-powered arbitrage competitively?
Competitive infrastructure requires $500,000-1,000,000 initial capital: $350K-450K for H100 GPU clusters, networking, and co-location; $150K-300K for exchange account balances across 50+ venues; $50K-100K for operational reserves. Cloud-based alternatives lower initial capex to $50K-100K but incur $70K/month operational costs, making ownership more cost-effective for continuous operation.
Why can't I just use cloud GPUs for arbitrage?
Cloud providers (AWS, Google Cloud, Azure) cannot guarantee sub-50ms latency to exchange servers due to variable routing and shared infrastructure. Typical cloud latency: 60-150ms. Owned infrastructure co-located with exchanges achieves sub-20ms via InfiniBand. For arbitrage opportunities lasting 100-200ms, the 40-130ms latency disadvantage reduces capture rate from 70-80% (owned) to 30-50% (cloud). Cloud GPUs work for statistical arbitrage (longer time horizons) but fail for latency arbitrage.
What's the minimum profitable arbitrage spread after fees?
For retail traders (0.10% taker fees on both exchanges): minimum 0.25-0.30% spread. For VIP-tier accounts (0.02-0.05% fees): minimum 0.10-0.15% spread. For market makers receiving rebates (negative fees): spreads as low as 0.05% are profitable. Most visible arbitrage opportunities are 0.15-0.25%—profitable only for institutional accounts with VIP tiers.
How does Zyra's system avoid getting rate-limited by exchanges?
Zyra uses predictive token bucket rate limiting—a lightweight ML model trained on historical API usage patterns that predicts the system's own request rate 10 seconds ahead. When the predicted rate approaches an exchange's limit (typically 300-600 requests/minute), the system preemptively throttles requests or routes orders to alternative venues. Post-deployment of this system in March 2025, API ban incidents dropped to zero.
Can RL models overfit to recent market conditions?
Yes, a common failure mode. Zyra's training pipeline includes temporal cross-validation: models trained on Month 1-2 data are validated on Month 3 out-of-sample data before production deployment. Additionally, ensemble methods combine 8 agents trained on different time windows (e.g., Agent 1: last 30 days; Agent 5: last 90 days), reducing sensitivity to any single market regime. If one agent performs poorly, the ensemble automatically reduces its weight in the final decision.
What happens when multiple AI systems compete for the same arbitrage?
The fastest system wins, and spreads close faster. This is already happening: the median duration of visible arbitrage opportunities has declined from ~300ms in 2023 to ~120ms in 2025 as more sophisticated players enter the market. The competitive response is twofold: (1) Speed: H100 clusters reduce evaluation time by 60-70% vs. A100s, enabling execution before competitors detect the opportunity; (2) Prediction: ML models predict spread widening 5-10s ahead, allowing pre-positioning before the arbitrage becomes visible to reactive systems.
Is crypto arbitrage legal? What about regulatory status?
Arbitrage is legal in most jurisdictions and is considered a market-neutral, liquidity-providing activity that improves price efficiency. Key regulatory considerations:
U.S.: No specific arbitrage restrictions; firms must comply with AML/KYC requirements and FinCEN reporting for large transactions
EU: MiFID II applies to algorithmic trading; registration required for high-frequency strategies
Asia: Varies by country; China restricts crypto trading entirely; Japan, Singapore, South Korea permit arbitrage with proper licensing
Cross-border capital movement may trigger additional reporting (e.g., FBAR for U.S. citizens with foreign exchange accounts >$10K). Always consult legal counsel for jurisdiction-specific requirements.
Related Reading
The Execution Gap: How Zyra Capital Connects AI Trading Signals to 50+ Crypto Exchanges
Building AI Trading Infrastructure: Inside Zyra Capital's NVIDIA H100 Training Architecture
Disclaimer: This content is for informational purposes only and does not constitute financial, investment, or legal advice. Cryptocurrency investments and arbitrage trading carry substantial risk, including the potential loss of principal. Past performance of trading strategies or infrastructure is not indicative of future results. Arbitrage strategies involve complex execution risks, exchange counterparty risks, and technological risks. Market conditions can change rapidly, eliminating arbitrage opportunities without warning. Hardware specifications and performance metrics cited are based on manufacturer specifications and internal testing as of March-April 2025; actual results may vary. Regulatory requirements for algorithmic trading vary by jurisdiction; always consult legal counsel before operating trading systems. For full risk disclosures, visit https://zyracapital.io/en/compliance/risk-disclosure.